1880 was the first year humanity had the capability to measure the average global temperature; 2014 was the hottest year since. According to NASA and National Oceanic and Atmospheric Administration (NOAA) scientists, 2014 was the warmest year on record. Except for one year back in 1998, the last 10 warmest years were after the turn of the millennium.
Surface temperature readings collected by scientists at NASA’s Goddard Institute of Space Studies (GISS) in New York published findings have once-again proved a long-term trend of global warming exists. NOAA took the raw data from GISS, analyzed it and released the same results Friday, January 16th, 2015. “NASA is at the forefront of the scientific investigation of the dynamics of the Earth’s climate on a global scale,” said associate administrator for the Science Mission Directorate at NASA Headquarters, John Grunsfeld. “The observed long-term warming trend and the ranking of 2014 as the warmest year on record reinforces the importance for NASA to study Earth as a complete system, and particularly to understand the role and impacts of human activity.”
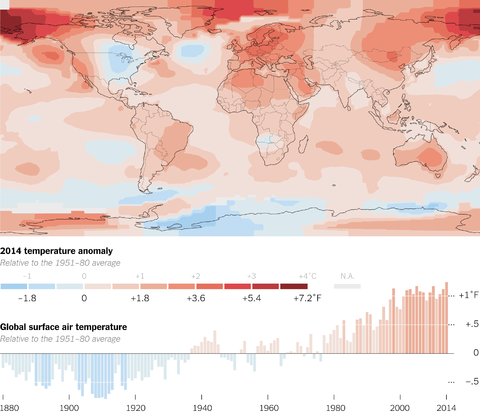 The average global surface temperature has increased by about 1.4 degrees Fahrenheit (0.8 degrees Celsius) since 1880, largely due to carbon emissions and other pollutants released into the atmosphere, with most of that warming occurring in the last 30 years.
“This is the latest in a series of warm years, in a series of warm decades. While the ranking of individual years can be affected by chaotic weather patterns, the long-term trends are attributable to drivers of climate change that right now are dominated by human emissions of greenhouse gases,” remarked GISS Director Gavin Schmidt.
The science community expects to see a noticeable influence on global temperatures from superstorms such as El Niño or La Niña. Weather phenomena can raise or lower temperatures in the tropical Pacific; many scientists think superstorms have the effect of flattening the trend for the last 15 years. Then again, the record highs we are seeing now occurred during an El Niño-neutral year. As chief NOAA scientist Richard Spinrad put it, “NOAA provides decision makers with timely and trusted science-based information about our changing world. As we monitor changes in our climate, demand for the environmental intelligence NOAA provides is only growing. It’s critical that we continue to work with our partners, like NASA, to observe these changes and to provide the information communities need to build resiliency.”
Regional differences in temperature are more strongly affected by weather dynamics than the global mean. For example, in the U.S. in 2014, parts of the Midwest and East Coast were unusually cool, while Alaska and three western states – California, Arizona and Nevada – experienced their warmest year on record, according to NOAA.
The GISS conclusions come from a vast body of data: 6,300 weather station surface temperature measurements from, ocean research facility sea surface temperatures, and Antarctic research stations, taking into account variations from urban areas and the spacing between data collection sites. The
NOAA team used mostly the same raw temperature data, but used an alternative algorithm to interpret the information.
Jonathan Howard
You can read the 2014 surface temperature measurements yourself at:
http://data.giss.nasa.gov/gistemp/
The methodology used to assess the data can be found here::
http://data.giss.nasa.gov/gistemp/sources_v3/
Learn more about NASA’s Earth science activities at:
http://www.nasa.gov/earthrightnow
|
Jonathan Howard
Jonathan is a freelance writer living in Brooklyn, NY |