Tag Archives: Global Warming

Arctic Sea Is Getting Thinner Faster


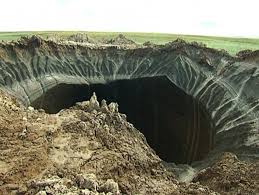
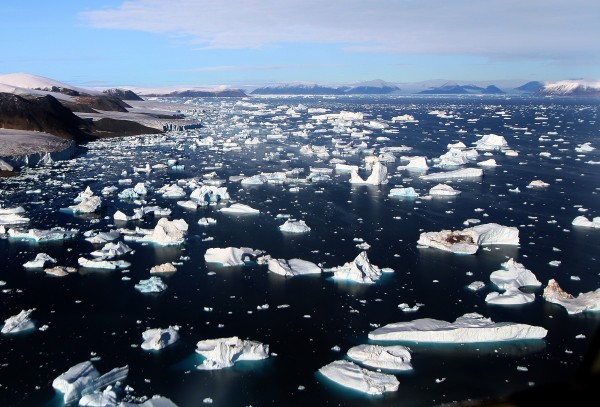
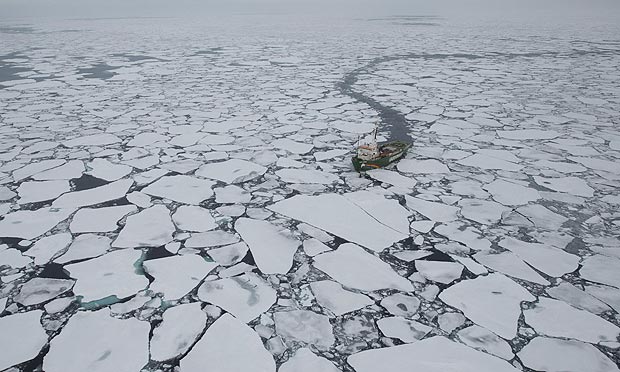
Many have pointed to the recent cold winter temperatures – particularly in the American Northeast and Midwest, as disproving the very imminent threats of global warming. Yet, these symptoms are actually directly related to the problem – as winter storms move further south, and Arctic ice diminishes, allowing cold winds to move freely. These temperatures have even correlated with the loss of ice in the Arctic Sea. While ice has disappeared from the Arctic at a consistently steady pace, the remaining ice is also becoming significantly thinner than normal – making it more prone to melting. At risk are not only the local ecosystems – something evidenced by the release of gases from thawing permafrost in Russia, but also shipping routes and routine ocean and atmospheric patterns. Even an event like the distant Arctic melting can have serious economic implications for everyone else.

The newest data has been gathered from a myriad of sources — Navy submarines as well as weather satellites — and points to the fact that the rate of thinning is occurring much more swiftly than what climate models have proposed, as indicated by an ambitious study seeking to draw a link between the wide variety of data. Researchers of the University of Washington Ron Lindsay and Axel Schweiger have calculated that within the Arctic Ocean’s central basin, the sea ice has shown a massive decline – thinning by about 65 percent since 1975. During September, the end of summer, at which point the ice is typically at its minimum levels for the year, ice thickness has been observed receding by an overwhelming 85 percent.

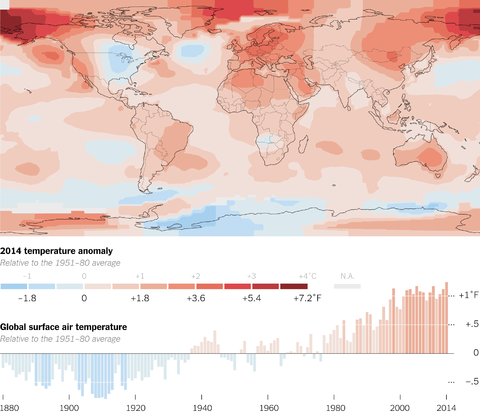
While the results hardly come as much surprise to those who have long accepted the science behind anthropogenic climate change, this information is crucial in one particular way. By next century, when temperatures are expected to rise by an estimate of 33.5 degrees Fahrenheit, parts of the Arctic may actually be free of ice – at least at certain times of the year.

The extent of ice lost has been readily available by NASA and NOAA weather satellites, but the particular thickness has not always been easy to measure. Knowledge of the ice volume might be of more immediate value when it comes to predicting the decline of ice as it varies depending on its proximity to the sea. It may be affected by not just overall surface temperatures, but also the temperature of the water as well. Although submarines as well as boats and helicopter missions take measurement of ice volume, along with some satellites already in space, each utilizes a different method of measurement, and getting the data to sync up is sometimes frustratingly difficult. The ESA’s Cryosat 2 for example, uses radar for measuring, while NASA’s ICESat used laser impulses to study the free flow of water through the Arctic in order to calculate volume.

With their new study, Lindsay and Schweiger worked to resolve differences between the measurements, an effort which Lindsay referred to as “an attempt to get all the ice thickness measurements into one place.” The study’s ultimate objective, according to Lindsay, is “to get a broad picture of what the sea ice is doing in the Arctic Ocean that is based more on observations than on a model.”

Their most shocking discovery when all the measurements were put together: On average, sea ice across the Arctic basin has decreased by about 18 inches per decade since the turn of the 21st century.

Since the earliest of the measurements taken in 1975, the annual average thickness in only the Arctic basin’s central portion declined from about 11 feet to only four feet — indicating an overall 65 percent decrease. Worse, this decline is almost double of the 36 percent decrease that a previous study had recorded between 1975-2000.

Although this new estimate of sea ice thinning which Lindsay and Schweiger described in the journal The Cryosphere, is far more dramatic than the projections of most climate models, Lindsay does agree that our current models do a reasonably decent job in predicting the loss of ice.

Julienne Stroeve, a sea ice researcher with the National Snow and Ice Data Center in Boulder, Colo., who was not involved with the research said in an email, “It would be great to have a long-term sea ice thickness dataset,” reminiscent of the the one pieced together by Lindsay and Schweiger, but the data is not without inherent, sometimes varying biases, meaning that often conclusions resulting from data combined in this way is sometimes difficult to trust.

In their paper, Lindsay and Schweiger fully acknowledge the potential errors that can be made from combining the data in such a way.

“This is just one attempt to put it together,” Lindsay asserted. “I think it is just a first step.”

James Sullivan
James Sullivan is the assistant editor of Brain World Magazine and a contributor to Truth Is Cool and OMNI Reboot. He can usually be found on TVTropes or RationalWiki when not exploiting life and science stories for another blog article.

How Carbon Dioxide is Cooking the Planet


A groundbreaking study has for the first time allowed scientists to witness the direct role that an increase in carbon dioxide (CO2) has on the planet’s greenhouse effect. Scientists at the Lawrence Berkeley National Laboratory (Berkeley Lab) of the U.S. Department of Energy led the researchers in their work, as they first analyzed the heightening capacity of CO2 in our atmosphere to take in any thermal radiation given off by the planet’s surface. For the study they looked at the impact on two different locations on the North American continent over an eleven year period.

While the influence atmospheric CO2 has over the Earth’s energy balance, that is the balance of energy transmitted to Earth from the Sun against the heat expelled from the Earth is well understood and agreed upon by the overwhelming majority of the scientific community, this was the first time anyone has demonstrated such an effect beyond the confines of a laboratory. Their results were published in Wednesday’s online issue of Nature.

The paper agrees with climatologist models of how man-made levels of CO2 will accelerate the greenhouse effect. The sites included in the study were based in Oklahoma as well as the Alaskan North Slope, throughout the years 2000 to 2010. In both locations, CO2 was the culprit for sharp spikes in a phenomenon known as positive radiative forcing – an event in which the atmosphere changes to the degree that it throws the energy balance of the planet off scale. It occurs when the Earth absorbs more solar radiation than what it releases back into space – something that can be measured either from the planet’s surface or high in the atmosphere. For their study, researchers focused on surface temperatures.

The overall consequence of this trend was an increase in atmospheric CO2 by 22 parts-per-million (PPM), much of which was the product of burning fossil fuels. At the moment, CO2 levels hover around 400 PPM, slightly above what are considered generally safe levels, and which will mean an increase in annual temperatures by about 33.5 degrees Fahrenheit. The International Panel on Climate Change (IPCC) and other organizations have aimed for a goal of keeping the levels from reaching 450 PPM, something that could likely happen by the year 2034 if worldwide measures are not taken at once to reduce CO2 levels.

“We see, for the first time in the field, the amplification of the greenhouse effect because there’s more CO2 in the atmosphere to absorb what the Earth emits in response to incoming solar radiation,” said Daniel Feldman, a scientist in Berkeley Lab’s Earth Sciences Division and the paper’s lead author.

In order to observe the increase in CO2 levels over time, the researchers used some of the most precise spectroscopic instruments, operated by facilities of the Atmospheric Radiation Measurement (ARM) Climate Research Facility at the Department of Energy. These instruments based at both sites, read the thermal infrared energy permeating through the atmosphere onto the Earth’s surface, which they then break down into spectral patterns – the signature of the CO2 particles.

These on-location instruments can also pick up and differentiate between which phenomena that are capable of giving off infrared energy, such as any passing clouds or water vapor with chemical components. Using a combination of data from this equipment, the team noticed a gradual rise in the CO2 levels, happening in real time.

“We measured radiation in the form of infrared energy. Then we controlled for other factors that would impact our measurements, such as a weather system moving through the area,” said Feldman.

Over 3,300 measurements were taken from the Alaska location and 8,300 measurements from Oklahoma, which were taken on a semi-daily basis.

The collected data from both sites revealed an identical trend: CO2 levels in the atmosphere emit increasing amounts of infrared energy, an approximation of 0.2 Watts per square meter per decade. While that’s a bit of a hard number to swallow – imagine then that the surface area Earth is about 196.9 million square miles.

A data analysis provided by the National Oceanic and Atmospheric Administration’s CarbonTracker system, the scientists linked this upswing in CO2-attributed radiative forcing to fossil fuel emissions and fires, which have become a growing concern in the Western states.

Another significant find among these measurements was the influence that photosynthesis – the conversion of solar radiation into food by plants – has on the balance of energy on Earth’s surface, which has never been measured in depth. The spring months showed slight dips in radiative forcing due to the growth of plants.

James Sullivan
James Sullivan is the assistant editor of Brain World Magazine and a contributor to Truth Is Cool and OMNI Reboot. He can usually be found on TVTropes or RationalWiki when not exploiting life and science stories for another blog article.

Why We Should Worry About Giant Siberian Craters


It seems only appropriate that Siberia, well known for being a cold and remote land, isolated from humanity, should be connected to the Yamal Peninsula, a name that literally means the ‘end of the world,’ and more lately than ever before, standing on it makes you’re on shaky ground. One of the recent mysteries of Yamal in recent years is why it has such a porous surface. According to scientists working at the Russian Academy of Sciences (RAS), the reason is giant craters, and not directly related to the number of meteors that have stricken Russia in recent years. This summer, locals reported sighting a sinkhole 260 feet wide. A further analysis by Russian geologists now indicates that the region during the winter could suffer up to 30 more.

Already, ten craters have been sighted throughout Yamal. Another crater, known as B2 is evidently surrounded with 20 smaller “baby craters,” all of which are filled with water, according to a report by the Siberian Times.

“I would compare this with mushrooms: when you find one mushroom, be sure there are few more around,” said Dr. Vasily Bogoyavlensky in his interview with the Siberian Times, invoking a popular pastime in rural Russia. “I suppose there could be 20 to 30 craters more.”

He is the Deputy Director of the Oil and Gas Research Institute of Moscow. He suspects that the incidence of these craters coincide with the locations of Siberia’s Bovanenkovo gas field, according to The Siberian Times.

Aside from meteors which were some significant YouTube sensations over the last few years, the cause remains something of a mystery. Some residents near Antipayuta of Siberia witnessed a flash near one of the craters. Some others living in Yamal reported tremors before the first of the sinkholes were sighted. Russian scientists have proposed one likely suspect: methane. There’s plenty of support for Bogoyavlensky’s claim too, as heightened levels of methane were reported in Siberia last summer. When the craters began to appear last July, scientists suspected that it may be among the most visible evidence we might have of the disastrous effects of global warming. Studies have attributed some of the more severe winters of the northern hemisphere to an increase in the loss of Arctic ice, in regions like Siberia, which have allowed cold jetstreams to move south. As temperatures rise, the permafrost begins thawing, releasing compounds like methane that then burst violently through the earth after centuries of buildup. As the ground warms over, it begins actively releasing more methane, while allowing for other tracts of land to thaw and eventually burst.

Bogoyavlensky is of the suspicion that these gas emissions, similar to those caused by fracking, may have had a role to play in forming the craters, as could violent explosions. Warm weather that thaws the Russian tundra could cause natural gas reserves located underground to burst outward, bringing up rocks and debris with it, he said. Bogoyavlensky’s team had earlier observed some ‘degassing’ taking place in the Yamal lakes – in which natural gas rises from beneath a lake bed – evidence supporting Bogoyavlensky’s proposed theory. There’s another significant danger if methane is to blame. While levels of CO2 are the main reason for concern with man-made global warming, methane is capable of committing 20 times the amount of harm as CO2 over a 100-year span.

Tom Wagner, a scientist at NASA, suspects that the sinkholes may be the result of the permafrost thawing and causing Siberian caves and underground tunnels to atrophy. Further investigation of the disaster areas is needed before either theory can be fully confirmed. Those who have observed the craters up close are reindeer herders indigenous to the region. Scientists have only viewed the giants from helicopters, after hearing the accounts of their sudden appearances. Although they hope to sample the craters and do more in-depth observation of the region, if Bogoyavlensky is correct, this sort of investigation could be dangerous, putting many geologists and other scientists in harm’s way, due to the land’s instability.

“These objects need to be studied, but it is rather dangerous for the researchers,” Bogoyavlensky said. “We know that there can occur a series of gas emissions over an extended period of time, but we do not know exactly when they might happen.”

If these are in fact gas emissions which are going unchecked, they could propose a significant threat to both drillers in the region as well as to people living in the local communities.

“It is important not to scare people,” Bogoyavlensky said of his approach, “but to understand that it is a very serious problem and we must research this.”

James Sullivan
James Sullivan is the assistant editor of Brain World Magazine and a contributor to Truth Is Cool and OMNI Reboot. He can usually be found on TVTropes or RationalWiki when not exploiting life and science stories for another blog article.

NASA Reports: 2014 Hottest Year Ever Recorded


1880 was the first year humanity had the capability to measure the average global temperature; 2014 was the hottest year since. According to NASA and National Oceanic and Atmospheric Administration (NOAA) scientists, 2014 was the warmest year on record. Except for one year back in 1998, the last 10 warmest years were after the turn of the millennium.

Surface temperature readings collected by scientists at NASA’s Goddard Institute of Space Studies (GISS) in New York published findings have once-again proved a long-term trend of global warming exists. NOAA took the raw data from GISS, analyzed it and released the same results Friday, January 16th, 2015. “NASA is at the forefront of the scientific investigation of the dynamics of the Earth’s climate on a global scale,” said associate administrator for the Science Mission Directorate at NASA Headquarters, John Grunsfeld. “The observed long-term warming trend and the ranking of 2014 as the warmest year on record reinforces the importance for NASA to study Earth as a complete system, and particularly to understand the role and impacts of human activity.”

NASA Reports: 2014 Hottest Year Ever RecordedThe average global surface temperature has increased by about 1.4 degrees Fahrenheit (0.8 degrees Celsius) since 1880, largely due to carbon emissions and other pollutants released into the atmosphere, with most of that warming occurring in the last 30 years.
“This is the latest in a series of warm years, in a series of warm decades. While the ranking of individual years can be affected by chaotic weather patterns, the long-term trends are attributable to drivers of climate change that right now are dominated by human emissions of greenhouse gases,” remarked GISS Director Gavin Schmidt.

The science community expects to see a noticeable influence on global temperatures from superstorms such as El Niño or La Niña. Weather phenomena can raise or lower temperatures in the tropical Pacific; many scientists think superstorms have the effect of flattening the trend for the last 15 years. Then again, the record highs we are seeing now occurred during an El Niño-neutral year. As chief NOAA scientist Richard Spinrad put it, “NOAA provides decision makers with timely and trusted science-based information about our changing world. As we monitor changes in our climate, demand for the environmental intelligence NOAA provides is only growing. It’s critical that we continue to work with our partners, like NASA, to observe these changes and to provide the information communities need to build resiliency.”

Regional differences in temperature are more strongly affected by weather dynamics than the global mean. For example, in the U.S. in 2014, parts of the Midwest and East Coast were unusually cool, while Alaska and three western states – California, Arizona and Nevada – experienced their warmest year on record, according to NOAA.
The GISS conclusions come from a vast body of data: 6,300 weather station surface temperature measurements from, ocean research facility sea surface temperatures, and Antarctic research stations, taking into account variations from urban areas and the spacing between data collection sites. The
NOAA team used mostly the same raw temperature data, but used an alternative algorithm to interpret the information.

Jonathan Howard

You can read the 2014 surface temperature measurements yourself at:
http://data.giss.nasa.gov/gistemp/
The methodology used to assess the data can be found here::
http://data.giss.nasa.gov/gistemp/sources_v3/
Learn more about NASA’s Earth science activities at:
http://www.nasa.gov/earthrightnow

Jonathan Howard
Jonathan is a freelance writer living in Brooklyn, NY