If you end up not using your Windows Phone as an actual phone anymore because you bought a new one, you don’t need to let it collect dust on the shelf
You can still use it for all sorts of media including ebooks, music and video on long car trips or in bed. Just because you don’t put cell phone service on it doesn’t mean it can’t still be used over wifi.
Internet company Tekoso Media has recently begun offering web hosting services including shared hosting, cloud hosting and storage, VPS hosting and dedicated servers for both Windows and Linux platforms. Prices are very cheap and come with generous software packages, security and cutting edge computer technology.
Also servers in the shared, VPS and managed server packages come with cPanel and a whole host of free add-ons that every internet marketer needs for their launch, including ticket systems, multiple email accounts, billing systems and membership functionality.
WordPress Hosting at Tekoso Media
WordPress is obviously a part of what they offer, but they go the extra mile by offering wordpress hosting at a discounted rate as well. On top of that, their point and click, drag and drop website creators and integrations make it very easy to get up and running within minutes.
If you’re launching a new product or service, or even hosting a blog network for search engine optimization such as authority blogs, Tekoso Web Hosting is your best bet for getting started fast and cheaply. For just a few bucks you can have lightning speed servers, more hard drive space and RAM than you’ll ever need and plenty of bandwidth, all without breaking the bank the way you would with competing web hosting providers.
Try Tekoso and take them for a test drive. They even offer a thirty day money back guarantee on any server that is unsatisfactory. This offer may be limited, so check them out today!
With the amount of data storage required for our daily lives growing and growing, and currently available technology being almost saturated, we’re in desperate need of a new method of data storage. The standard magnetic hard disk drive (HDD) – like what’s probably in your laptop computer – has reached its limit, holding a maximum of a few terabytes. Standard optical disk technologies, like compact disc (CD), digital video disc (DVD) and Blu-ray disc, are restricted by their two-dimensional nature – they just store data in one plane – and also by a physical law called the diffraction limit, based on the wavelength of light, that constrains our ability to focus light to a very small volume.
And then there’s the lifetime of the memory itself to consider. HDDs, as we’ve all experienced in our personal lives, may last only a few years before things start to behave strangely or just fail outright. DVDs and similar media are advertised as having a storage lifetime of hundreds of years. In practice this may be cut down to a few decades, assuming the disk is not rewritable. Rewritable disks degrade on each rewrite.
Without better solutions, we face financial and technological catastrophes as our current storage media reach their limits. How can we store large amounts of data in a way that’s secure for a long time and can be reused or recycled?
In our lab, we’re experimenting with a perhaps unexpected memory material you may even be wearing on your ring finger right now: diamond. On the atomic level, these crystals are extremely orderly – but sometimes defects arise. We’re exploiting these defects as a possible way to store information in three dimensions.
Focusing on tiny defects
One approach to improving data storage has been to continue in the direction of optical memory, but extend it to multiple dimensions. Instead of writing the data to a surface, write it to a volume; make your bits three-dimensional. The data are still limited by the physical inability to focus light to a very small space, but you now have access to an additional dimension in which to store the data. Some methods also polarize the light, giving you even more dimensions for data storage. However, most of these methods are not rewritable.
Here’s where the diamonds come in.
The orderly structure of a diamond, but with a vacancy and a nitrogen replacing two of the carbon atoms. Zas2000
A diamond is supposed to be a pure well-ordered array of carbon atoms. Under an electron microscope it usually looks like a neatly arranged three-dimensional lattice. But occasionally there is a break in the order and a carbon atom is missing. This is what is known as a vacancy. Even further tainting the diamond, sometimes a nitrogen atom will take the place of a carbon atom. When a vacancy and a nitrogen atom are next to each other, the composite defect is called a nitrogen vacancy, or NV, center. These types of defects are always present to some degree, even in natural diamonds. In large concentrations, NV centers can impart a characteristic red color to the diamond that contains them.
Nitrogen vacancy centers have a tendency to trap electrons, but the electron can also be forced out of the defect by a laser pulse. For many researchers, the defects are interesting only when they’re holding on to electrons. So for them, the fact that the defects can release the electrons, too, is a problem.
But in our lab, we instead look at these nitrogen vacancy centers as a potential benefit. We think of each one as a nanoscopic “bit.” If the defect has an extra electron, the bit is a one. If it doesn’t have an extra electron, the bit is a zero. This electron yes/no, on/off, one/zero property opens the door for turning the NV center’s charge state into the basis for using diamonds as a long-term storage medium.
Starting from a blank ensemble of NV centers in a diamond (1), information can be written (2), erased (3), and rewritten (4). Siddharth Dhomkar and Carlos A. Meriles, CC BY-ND
Turning the defect into a benefit
Previous experiments with this defect have demonstrated some properties that make diamond a good candidate for a memory platform.
First, researchers can selectively change the charge state of an individual defect so it either holds an electron or not. We’ve used a green laser pulse to assist in trapping an electron and a high-power red laser pulse to eject an electron from the defect. A low-power red laser pulse can help check if an electron is trapped or not. If left completely in the dark, the defects maintain their charged/discharged status virtually forever.
The NV centers can encode data on various levels. Siddharth Dhomkar and Carlos A. Meriles, CC BY-ND
Our method is still diffraction limited, but is 3-D in the sense that we can charge and discharge the defects at any point inside of the diamond. We also present a sort of fourth dimension. Since the defects are so small and our laser is diffraction limited, we are technically charging and discharging many defects in a single pulse. By varying the duration of the laser pulse in a single region we can control the number of charged NV centers and consequently encode multiple bits of information.
Though one could use natural diamonds for these applications, we use artificially lab-grown diamonds. That way we can efficiently control the concentration of nitrogen vacancy centers in the diamond.
All these improvements add up to about 100 times enhancement in terms of bit density relative to the current DVD technology. That means we can encode all the information from a DVD into a diamond that takes up about one percent of the space.
Past just charge, to spin as well
If we could get beyond the diffraction limit of light, we could improve storage capacities even further. We have one novel proposal on this front.
Nitrogen vacancy centers have also been used in the execution of what is called super-resolution microscopy to image things that are much smaller than the wavelength of light. However, since the super-resolution technique works on the same principles of charging and discharging the defect, it will cause unintentional alteration in the pattern that one wants to encode. Therefore, we won’t be able to use it as it is for memory storage application and we’d need to back up the already written data somehow during a read or write step.
Here we propose the idea of what we call charge-to-spin conversion; we temporarily encode the charge state of the defect in the spin state of the defect’s host nitrogen nucleus. Spin is a fundamental property of any elementary particle; it’s similar to its charge, and can be imagined as having a very tiny magnet permanently attached it.
While the charges are being adjusted to read/write the information as desired, the previously written information is well protected in the nitrogen spin state. Once the charges have encoded, the information can be back converted from the nitrogen spin to the charge state through another mechanism which we call spin-to-charge conversion.
With these advanced protocols, the storage capacity of a diamond would surpass what existing technologies can achieve. This is just a beginning, but these initial results provide us a potential way of storing huge amount of data in a brand new way. We’re looking forward to transform this beautiful quirk of physics into a vastly useful technology.
How do humans interpret and understand art? The nature of artistic style, seemingly abstract and intuitive, is the subject of ongoing debate within art history and the philosophy of art.
When we talk about paintings, artistic style can refer to image features like the brushstrokes, contour and distribution of colors that painters employ, often implicitly, to construct their works. An artist’s style helps convey meaning and intent, and affects the aesthetic experience a user has when interacting with that artwork. Style also helps us identify and sometimes categorize their work, often placing it in the context of a specific period or place.
A new field of research aims to deepen, and even quantify, our understanding of this intangible quality. Inherently interdisciplinary, visual stylometry uses computational and statistical methods to calculate and compare these underlying image features in ways humans never could before. Instead of relying only on what our senses perceive, we can use these mathematical techniques to discover novel insights into artists and artworks.
A new way to see paintings
Quantifying artistic style can help us trace the cultural history of art as schools and artists influence each other through time, as well as authenticate unknown artworks or suspected forgeries and even attribute works that could be by more than one artist to a best matching artist. It can also show us how an artist’s style and approach changes over the course of a career.
Computer analysis of even previously well-studied images can yield new relationships that aren’t necessarily apparent to people, such as Gaugin’s printmaking methods. In fact, these techniques could actually help us discover how humans perceive artworks.
Art scholars believe that a strong indicator of an artist’s style is the use of color and how it varies across the different parts of a painting. Digital tools can aid this analysis.
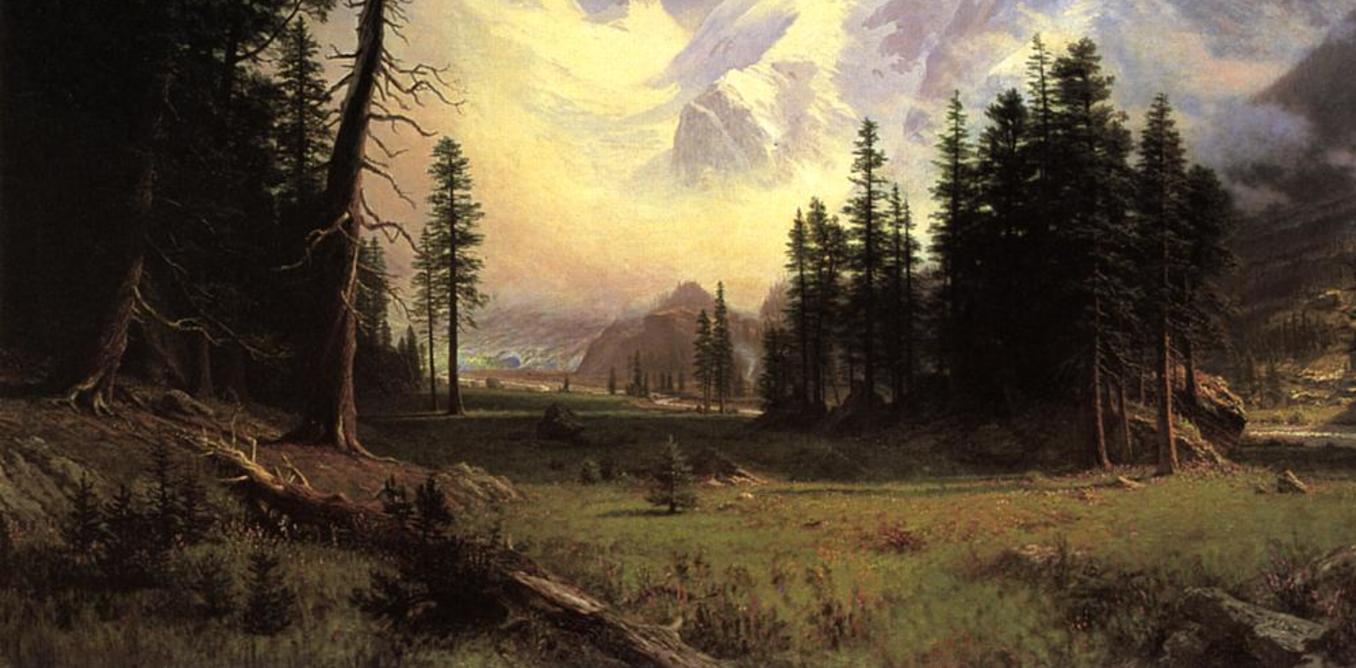
‘The Morteratsch Glacier, Upper Engadine Valley, Pontresina, by
Albert Bierstadt, 1895. Wikiart
Scanning the image breaks it down into individual pixels with numeric values for how much red, green and blue is in each tiny section of the painting. Calculating the difference in those values between each pixel and the others near it, throughout the painting, shows us how these tonal features vary across the work. We can then represent those values graphically, giving us another view of the painting:
Output of a discrete tonal measure analysis. Author provided
This can help us start to categorize the style of an artist as using greater or fewer textural components, for example. When we did this as part of an analysis of many paintings in the Impressionist and Hudson River schools, our system could sort each painting by school based on its tonal distribution.
We might wonder if the background of a painting more strongly reflects the artist’s style. We can extract that section alone and examine its specific tonal features:
Output of foreground/background extraction. Author provided
Then we could compare analyses, for example, of the painting as a whole against only its background or foreground. From our data on Impressionist and Hudson River paintings, our system was able to identify individual artists – and it did so better when examining foregrounds and backgrounds separately, rather than when analyzing whole paintings.
Sharing the ability to analyze art
Despite the effectiveness of these sorts of computational techniques at discerning artistic style, they are relatively rarely used by scholars of the humanities. Often that’s because researchers and students don’t have the requisite computer programming and machine-learning skills. Until recently, artists and art historians without those skills, and who did not have access to computer scientists, simply had to do without these methods to help them analyze their collections.
Our team, consisting of experts in computer science, the philosophy of art and cognitive science, is developing a digital image analysis tool for studying paintings in this new way. This tool, called Workflows for Analysis of Images and Visual Stylometry (WAIVS), will allow students and researchers in many disciplines, even those without significant computer skills, to analyze works of art for research, as well as for art appreciation.
WAIVS, built upon the Wings workflow system, allows users to construct analyses in the same way they would draw a flowchart. For instance, to compare the tonal analyses of the whole painting and the background alone, as described above, a scholar need not create complex computer software, but rather would just create this design of the process:
Scientific workflow for discrete tonal measure analysis. Author provided
The diagram is actually a computer program, so once the user designs the workflow, they can simply click a button to conduct the analysis. WAIVS includes not just discrete tonal analysis but other image-analysis algorithms, including the latest computer vision and artistic style algorithms.
Another example: neural algorithm of artistic style
Recent work by Leon Gatys and others at the University of Tübingen, Germany, has demonstrated the use of deep learning techniques and technology to create images in the style of the great masters like Van Gogh and Picasso.
The specific deep learning approach, called convolutional neural networks, learns to separate the content of a painting from its style. The content of a painting consists of objects, shapes and their arrangements but usually does not depend upon the use of colors, textures and other aspects of artistic style.
A painting’s style, extracted in this manner, cannot be viewed on its own: it is purely mathematical in nature. But it can be visualized by applying the extracted style to the content of another painting or photo, making an image by one artist look like it’s by someone else.
Our group has incorporated these techniques into WAIVS and, as we add more cutting-edge algorithms, art scholars will be able to apply the latest research to their analyses, using our simple workflows. For example, we were able to use WAIVS to recreate the Bierstadt painting in other artists’ styles:
The Bierstadt painting in the styles of, clockwise from upper left, Van Gogh, Munch, Kahlo, Picasso, Matisse and Escher. Author provided
Connecting disciplines
Eventually, we intend to incorporate WAIVS within a Beam+ telepresence system to allow people to virtually visit real-world museum displays. People around the world could not only view the art but also be able to run our digital analyses. It would dramatically expand public and scholarly access to this new method of contemplating art, and open new avenues for teaching and research.
Our hope is that WAIVS will not only improve access of humanities researchers to computerized tools, but also promote technological literacy and data analysis skills among humanities students. In addition, we expect it to introduce science students to research in art and the humanities, to explore the nature of artistic style and its role in our understanding of artwork. We also hope it will help researchers in cognitive science understand how viewers perceptually categorize, recognize and otherwise engage with art.
Big data offers us a window on the world. But large and easily available datasets may not show us the world we live in. For instance, epidemiological models of the recent Ebola epidemic in West Africa using big data consistently overestimated the risk of the disease’s spread and underestimated the local initiatives that played a critical role in controlling the outbreak.
Researchers are rightly excited about the possibilities offered by the availability of enormous amounts of computerized data. But there’s reason to stand back for a minute to consider what exactly this treasure trove of information really offers. Ethnographers like me use a cross-cultural approach when we collect our data because family, marriage and household mean different things in different contexts. This approach informs how I think about big data.
We’ve all heard the joke about the drunk who is asked why he is searching for his lost wallet under the streetlight, rather than where he thinks he dropped it. “Because the light is better here,” he said.
This “streetlight effect” is the tendency of researchers to study what is easy to study. I use this story in my course on Research Design and Ethnographic Methods to explain why so much research on disparities in educational outcomes is done in classrooms and not in students’ homes. Children are much easier to study at school than in their homes, even though many studies show that knowing what happens outside the classroom is important. Nevertheless, schools will continue to be the focus of most research because they generate big data and homes don’t.
The streetlight effect is one factor that prevents big data studies from being useful in the real world – especially studies analyzing easily available user-generated data from the Internet. Researchers assume that this data offers a window into reality. It doesn’t necessarily.
Looking at WEIRDOs
Based on the number of tweets following Hurricane Sandy, for example, it might seem as if the storm hit Manhattan the hardest, not the New Jersey shore. Another example: the since-retired Google Flu Trends, which in 2013 tracked online searches relating to flu symptoms to predict doctor visits, but gave estimates twice as high as reports from the Centers for Disease Control and Prevention. Without checking facts on the ground, researchers may fool themselves into thinking that their big data models accurately represent the world they aim to study.
The problem is similar to the “WEIRD” issue in many research studies. Harvard professor Joseph Henrich and colleagues have shown that findings based on research conducted with undergraduates at American universities – whom they describe as “some of the most psychologically unusual people on Earth” – apply only to that population and cannot be used to make any claims about other human populations, including other Americans. Unlike the typical research subject in psychology studies, they argue, most people in the world are not from Western, Educated, Industrialized, Rich and Democratic societies, i.e., WEIRD.
Twitter users are also atypical compared with the rest of humanity, giving rise to what our postdoctoral researcher Sarah Laborde has dubbed the “WEIRDO” problem of data analytics: most people are not Western, Educated, Industrialized, Rich, Democratic and Online.
Context is critical
Understanding the differences between the vast majority of humanity and that small subset of people whose activities are captured in big data sets is critical to correct analysis of the data. Considering the context and meaning of data – not just the data itself – is a key feature of ethnographic research, argues Michael Agar, who has written extensively about how ethnographers come to understand the world.
What makes research ethnographic? It is not just the methods. It starts with fundamental assumptions about the world, the first and most important of which is that people see and experience the world in different ways, giving them different points of view. Second, these differences result from growing up and living in different social and cultural contexts. This is why WEIRD people are not like any other people on Earth.
The task of the ethnographer, then, is to translate the point of view of the people they study into the point of view of their audience. Discovering other points of view requires ethnographers go through multiple rounds of data collection and analysis and incorporate concepts from the people they study in the development of their theoretical models. The results are models that are good representations of the world – something analyses of big data frequently struggle to achieve.
Here is an example from my own research with mobile pastoralists. When I tried to make a map of my study area in the Logone Floodplain of Cameroon, I assumed that places had boundaries, as the one separating Ohio from Michigan. Only later, after multiple interviews and observations, did I learn that it is better to think of places in the floodplain as points in an open system, like Columbus and Ann Arbor, without any boundary between them. Imagine that!
Don’t get me wrong: I think big data is great. In our interdisciplinary research projects studying the ecology of infectious diseases and regime shifts in coupled human and natural systems, we are building our own big data sets. Of course, they are not as big as those generated by Twitter or Google users, but big enough that the analytical tools of complexity theory are useful to make sense of the data because the systems we study are more than the sum of their parts.
Moreover, we know what the data represents, how it was collected and what its limitations are. Understanding the context and meaning of the data allows us to check our findings against our knowledge of the world and validate our models. For example, we have collected data on livestock movements using a combination of surveys and GPS technology in Cameroon to build computer models and examine its impact on the spread of foot-and-mouth disease. Because we know the pastoralists and the region in which they move, we can detect the errors and explain the patterns in the data.
For data analytics to be useful, it needs to be theory- or problem-driven, not simply driven by data that is easily available. It should be more like ethnographic research, with data analysts getting out of their labs and engaging with the world they aim to understand.
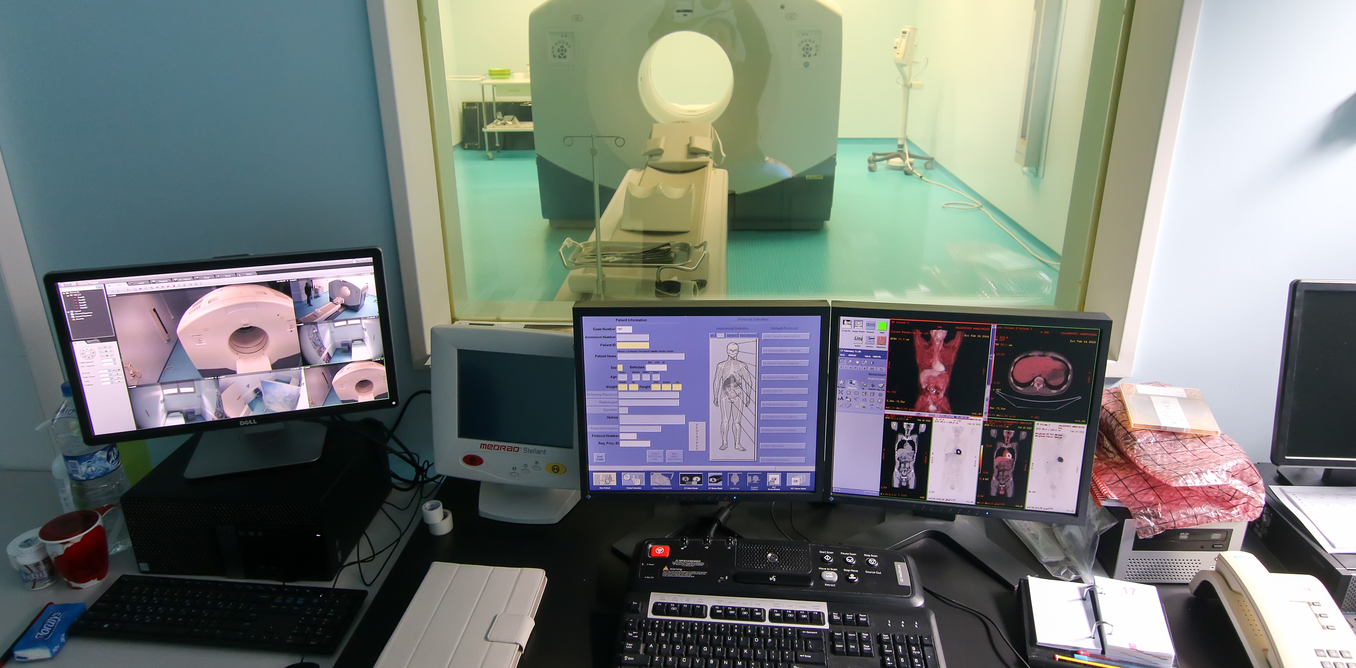
CAT scans, MRI, ultrasound. We are all pretty used to having machines – and doctors – peering into our bodies for a whole range of reasons. This equipment can help diagnose diseases, pinpoint injuries, or give expectant parents the first glimpse of their child.
As computational power has exploded in the past half-century, it has enabled a parallel expansion in the capabilities of these computer-aided imaging systems. What used to be pictures of two-dimensional “slices” have been assembled into high-resolution three-dimensional reconstructions. Stationary pictures of yesteryear are today’s real-time video of a beating heart. The advances have been truly revolutionary.
A cardiac MRI scan shows a heart beating.
Though different in their details, X-ray computed tomography, ultrasound and even MRI have a lot in common. The images produced by each of these systems derive from an elegant interplay of sensors, physics and computation. They do not operate like a digital camera, where the data captured by the sensor are basically identical to the image produced. Rather, a lot of processing must be applied to the the raw data collected by a CAT scanner, MRI machine or ultrasound system to produce before it the images needed for a doctor to make a diagnosis. Sophisticated algorithms based on the underlying physics of the sensing process are required to put Humpty Dumpty back together again.
Early scanning methods
One of the first published X-rays (at right, with normal view of the hand at left), from 1896. Albert Londe A modern hand X-ray. golanlevin/flickr, CC BY
Though we use X-rays in some cutting-edge imaging techniques, X-ray imaging actually dates back to the late 1800s. The shadowlike contrast in X-ray images, or projections, shows the density of the material between the X-ray source and the data sensor. (In the past this was a piece of X-ray film, but today is usually a digital detector.) Dense objects, such as bones, absorb and scatter many more X-ray photons than skin, muscle or other soft tissue, which appear darker in the projections.
But then in the early 1970s, X-ray CAT (which stands for Computerized Axial Tomography) scans were developed. Rather than taking just a single X-ray image from one angle, a CAT system rotates the X-ray sources and detectors to collect many images from different angles – a process known as tomography.
Computerized tomography imagery of a hand.
The difficulty is how to take all the data, from all those X-rays from so many different angles, and get a computer to properly assemble them into 3D images of, say, a person’s hand, as in the video above. That problem had a mathematical solution that had been studied by the Austrian mathematician Johann Radon in 1917 and rediscovered by the American physicist (and Tufts professor) Allan Cormack in the 1960s. Using Cormack’s work, Godfrey Hounsfield, an English electrical engineer, was the first to demonstrate a working CAT scanner in 1971. For their work on CAT, Cormack and Hounsfield received the 1979 Nobel Prize in Medicine.
Extending the role of computers
Until quite recently, these processing methods had more or less been constant since the 1970s and 1980s. Today, additional medical needs – and more powerful computers – are driving big changes. There is increased interest in CT systems that minimize X-ray exposure, yielding high-quality images from fewer images. In addition, certain uses, such as breast imaging, encounter physical constraints on how much access the imager can have to the body part. This requires scanning from only a very limited set of angles around the subject. These situations have led to research into what are called “tomosynthesis” systems – in which limited data are interpreted by computers to form fuller images.
Similar problems arise, for example, in the context of imaging the ground to see what objects – such as pollutants, land mines or oil deposits – are hidden beneath our feet. In many cases, all we can do is send signals from the surface, or drill a few holes to take sampling measurements. Security scanning in airports is constrained by cost and time, so those X-ray systems can take only a few images.
In these and a host of other fields, we are faced with less overall data, which means the Cormack-Hounsfield mathematics can’t work properly to form images. The effort to solve these problems has led to the rise of a new area of research, “computational sensing,” in which sensors, physics and computers are being brought together in new ways.
Sometimes this involves applying more computer processing power to the same data. In other cases, hardware engineers designing the equipment work closely with the mathematicians figuring out how best to analyze the data provided. Together these systems can provide new capabilities that hold the promise of major changes in many research areas.
New scanning capabilities
One example of this potential is in bio-optics, the use of light to look deep within the human body. While visible light does not penetrate far into tissue, anyone who has shone a red laser pointer into their finger knows that red light does in fact make it through at least a couple of centimeters. Infrared light penetrates even farther into human tissue. This capability opens up entirely new ways to image the body than X-ray, MRI or ultrasound.
Again, it takes computing power to move from those images into a unified 3D portrayal of the body part being scanned. But the calculations are much more difficult because the way in which light interacts with tissue is far more complex than X-rays.
As a result we need to use a different method from that pioneered by Cormack in which X-ray data are, more or less, directly turned into images of the body’s density. Now we construct an algorithm that follows a process over and over, feeding the result from one iteration back as input of the next.
The process starts by having the computer guess an image of the optical properties of the body area being scanned. Then it uses a computer model to calculate what data from the scanner would yield that image. Perhaps unsurprisingly, the initial guess is generally not so good: the calculated data don’t match the actual scans.
When that happens, the computer goes back and refines its guess of the image, recalculates the data associated with this guess and again compares with the actual scan results. While the algorithm guarantees that the match will be better, it is still likely that there will be room for improvement. So the process continues, and the computer generates a new and more improved guess.
Over time, its guesses get better and better: it creates output that looks more and more like the data collected by the actual scanner. Once this match is close enough, the algorithm provides the final image as a result for examination by the doctor or other professional.
The new frontiers of this type of research are still being explored. In the last 15 years or so, researchers – including my Tufts colleague Professor Sergio Fantini – have explored many potential uses of infrared light, such as detecting breast cancer, functional brain imaging and drug discovery. Combining “big data” and “big physics” requires a close collaboration among electrical and biomedical engineers as well as mathematicians and doctors. As we’re able to develop these techniques – both mathematical and technological – we’re hoping to make major advances in the coming years, improving how we all live.
Eric Miller, Professor and Chair of Electrical and Computer Engineering, Adjunct Professor of Computer Science, Adjunct Professor of Biomedical Engineering, Tufts University
It just got a whole lot easier for local and federal law enforcement to gain unauthorized access to computers connected to the internet when the Supreme Court approved changes to the rules of criminal procedure recently. The changes have enabled warrants for searches of any remote computer system despite local laws, ownership and physical location.
These warrants are particularly important to computer crimes divisions since many investigations result in turning up anonymous hosts, or users who don’t share their true identity in any way.
Unless congress takes action beforehand, the new law goes into affect in December of 2016.
Scientists have found a new way through which the cells of our body can be controlled through a proprietary programming language, which could help you from falling prey to diseases. This latest innovation comes from a group of biological engineers at MIT, who have developed a programming language capable of designing complex DNA functions that can further be put in a human being’s cell.
How does it work?
Commenting on the functionality of the latest innovation, Christopher Voigt, a biological engineering professor at MIT revealed that it was more of text-based language used to program a computer. Similarly, the program is then compiled into a DNA sequence, which is then inputted into the cell, and its circuit runs within the cell.
How did they do it?
Verilog, a hardware description language has been used by researchers to make this a reality. Sensors that can be programmed into DNA sequences have been used with specially designed computing elements.
The interesting part lies in the way the program works. The DNA sequences are first programmed into a cell to create a circuit. The customizable sensors then detect the amount of glucose, oxygen, and temperature. What wonders science and technology today can put together is completely inspiring.
It seems that every year there are new technologies coming out that are even more amazing than what the previous year held. From self-driving cars to robots entering daily lives, the world is changing at an incredibly fast rate. Click the ‘Next’ button below to see 12 new technologies on the scene in 2016!


